


WITH CHEETAH
Dashboards & Score Panels
Dashboards & Score Panels
Create dashboards tailored to your specific business needs. Consolidate your KPIs, performance metrics, and operational data into a single, unified view. With intuitive filtering options, you can access the exact data you need in an instant.
Monitor your critical indicators and targets in real-time. Keep a close eye on performance shifts without delay, detect deviations early, and accelerate your data-driven decision-making processes.
Real-Time KPI Monitoring
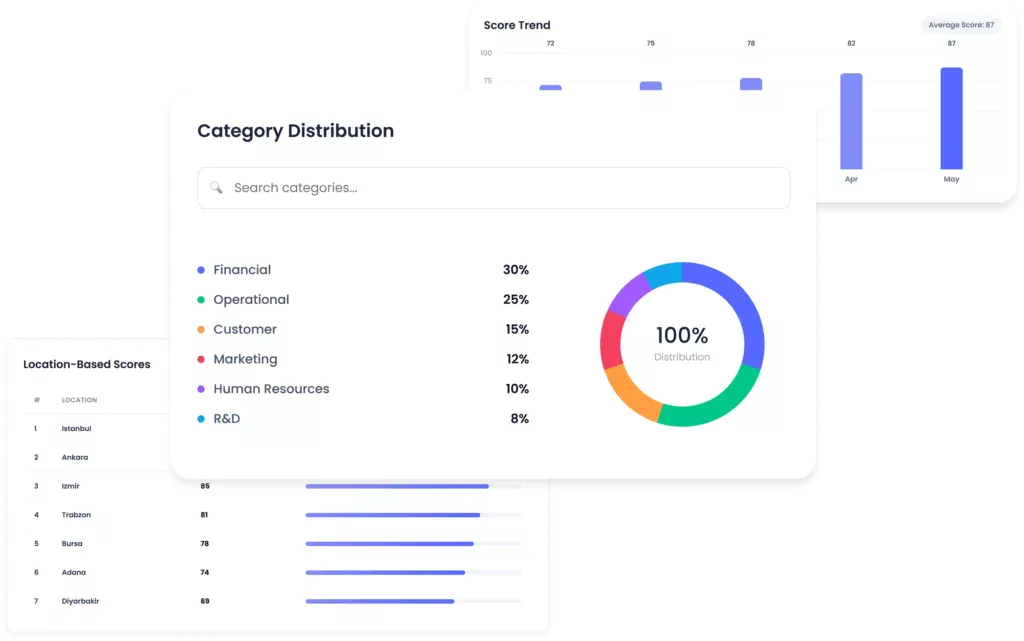
Visualize the performance of your regions, branches, or field teams through map-based reporting. Analyze location-specific scores, conduct easy comparisons, and pinpoint areas for operational improvement with precision.
Map-Supported Analytical Reporting
Consolidate data from ERP, CRM, HR systems, form submissions, or other corporate applications into a single central hub. Information from different sources is automatically synchronized.
Define the KPIs, performance metrics, and targets you wish to track. Create custom indicators tailored to your specific departments, processes, projects, or teams.
Design your dashboard using charts, tables, scorecards, and map components. With dynamic filters, users can easily access the specific data they need.
Track performance in real-time, detect target deviations early, and manage operational decisions based on data. Use analytical reports to identify opportunities for continuous improvement.
Corporate KPI Management
View company-wide performance indicators on a single dashboard. Monitor target realizations, department-specific scores, and critical metrics in real-time.
Process & Team Performance
Track operational KPIs, workloads, and process performance on one screen. Rapidly identify bottlenecks and performance dips.
Location-Based Performance Analytics
Use map-supported reports to compare the performance of branches, regions, or field teams and pinpoint areas for improvement.
Turn your processes into products and applications in no time with the features of the Cheetah Low-Code Development Platform!
The Dashboard is a visual reporting interface that brings together KPIs, performance metrics and targets on a single screen. Decision-makers can quickly see the state of the business without getting lost in a sea of scattered reports.
You can view only the data you need by using filters based on department, location, date, team, project or metrics. This approach allows users to quickly narrow down their analysis scope.
It allows you to see changes in key indicators without delay. This means that swift action can be taken when deviations from targets or drops in performance occur; this is why warning and alarm mechanisms are a key feature in similar products.
It is used to compare the performance of branches, regions, field teams or different locations. Map visualisations make it easier to understand geographical data at a glance.
It can be used by all roles involved in performance monitoring, such as senior management, operational teams, sales managers, HR and IT teams. It is particularly useful when different teams need to view the same set of KPIs using different filters.
It centralises data, simplifies key metrics and ensures that teams are working from the same information. This reduces the time spent on report preparation, speeds up analysis and accelerates the decision-making process.
