Dashboards
Transform Data into Value with Dashboards & Score Panels!
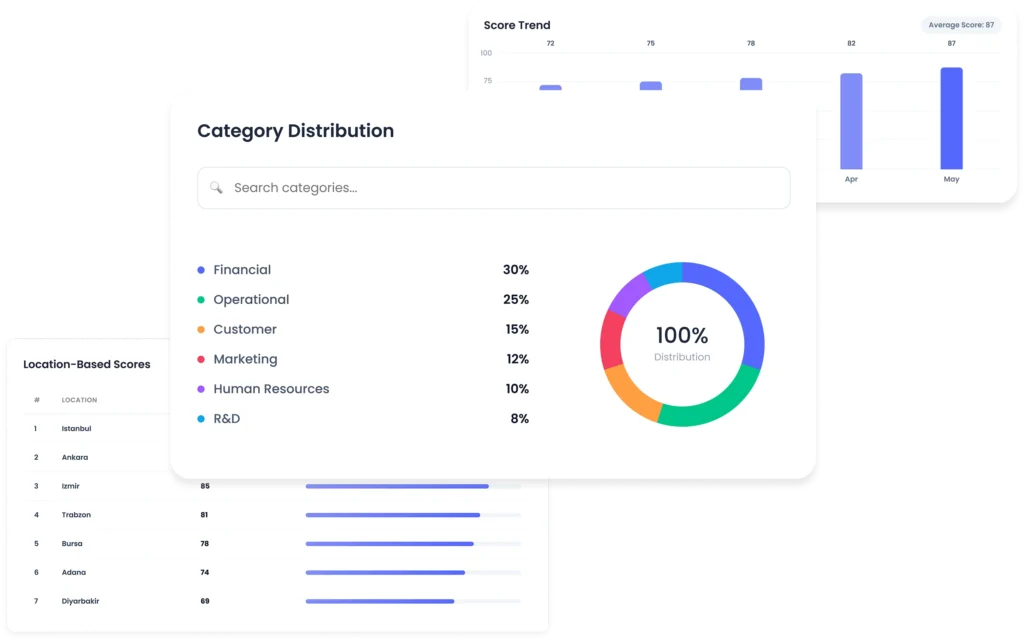
Leverage Cheetah Platform’s Dashboards & Score Panels to utilize dynamic filters, monitor performance in real-time, and empower your decision-making with location-based reporting.


Dashboard
Problem & Solution
CURRENT STATE
Data is scattered across various Excel files, disparate systems, and departments.
Performance metrics are prepared manually, causing reports to become outdated quickly.
Decision-makers must check multiple sources to access the data they need.
Critical KPIs and target deviations are identified too late, resulting in delayed corrective actions.
Comparing and analyzing performance across locations, teams, or departments is cumbersome.
Rigid, static reports cannot be filtered to meet changing needs and lack deep-dive analytical capabilities.

WITH CHEETAH
Dashboards & Score Panels
All performance metrics are consolidated in one hub and updated in real-time.
Users can access the specific data they need instantly.
Easily monitor KPIs, targets, and performance scores through intuitive visual panels.
Quickly identify indicators falling below critical thresholds to take rapid, informed action.
Gain deep insights with map-supported reporting for location-specific performance tracking.
The flexible reporting architecture allows you to build custom panels for any department, team, process, or project.
Feature Benefits
Operational Impact of
Dashboards & Score Panels
Dynamic Dashboards
Create dashboards tailored to your specific business needs. Consolidate your KPIs, performance metrics, and operational data into a single, unified view. With intuitive filtering options, you can access the exact data you need in an instant.
Dynamic Dashboard Management
Real-Time Performance Tracking
Monitor your critical indicators and targets in real-time. Keep a close eye on performance shifts without delay, detect deviations early, and accelerate your data-driven decision-making processes.
Real-Time KPI Monitoring
Location-Based Reporting & Analytics
Visualize the performance of your regions, branches, or field teams through map-based reporting. Analyze location-specific scores, conduct easy comparisons, and pinpoint areas for operational improvement with precision.
Map-Supported Analytical Reporting
Step-by-Step
How It Works?
Connect Data Sources
Consolidate data from ERP, CRM, HR systems, form submissions, or other corporate applications into a single central hub. Information from different sources is automatically synchronized.
Define Your Indicators
Define the KPIs, performance metrics, and targets you wish to track. Create custom indicators tailored to your specific departments, processes, projects, or teams.
Build Your Dashboard
Design your dashboard using charts, tables, scorecards, and map components. With dynamic filters, users can easily access the specific data they need.
Monitor & Take Action
Track performance in real-time, detect target deviations early, and manage operational decisions based on data. Use analytical reports to identify opportunities for continuous improvement.
Use Cases
Who Uses Dashboards & Score Panels?
Executive Management
Corporate KPI Management
View company-wide performance indicators on a single dashboard. Monitor target realizations, department-specific scores, and critical metrics in real-time.
Data-Driven Decision Making
Operations Manager
Process & Team Performance
Track operational KPIs, workloads, and process performance on one screen. Rapidly identify bottlenecks and performance dips.
Enhanced Performance Visibility
Regional / Branch Manager
Location-Based Performance Analytics
Use map-supported reports to compare the performance of branches, regions, or field teams and pinpoint areas for improvement.
Location-Based Insights
SPIDYA
Cheetah Low - Code Features
Turn your processes into products and applications in no time with the features of the Cheetah Low-Code Development Platform!
F.A.Q
Frequently Asked Questions
What is the Dashboard & Scorecard?
The Dashboard is a visual reporting interface that brings together KPIs, performance metrics and targets on a single screen. Decision-makers can quickly see the state of the business without getting lost in a sea of scattered reports.
What data can I access using dynamic filters?
You can view only the data you need by using filters based on department, location, date, team, project or metrics. This approach allows users to quickly narrow down their analysis scope.
Why is real-time tracking important?
It allows you to see changes in key indicators without delay. This means that swift action can be taken when deviations from targets or drops in performance occur; this is why warning and alarm mechanisms are a key feature in similar products.
When is map support used?
It is used to compare the performance of branches, regions, field teams or different locations. Map visualisations make it easier to understand geographical data at a glance.
Who uses the Dashboard & Scorecard?
It can be used by all roles involved in performance monitoring, such as senior management, operational teams, sales managers, HR and IT teams. It is particularly useful when different teams need to view the same set of KPIs using different filters.
How does this panel contribute to decision-making processes?
It centralises data, simplifies key metrics and ensures that teams are working from the same information. This reduces the time spent on report preparation, speeds up analysis and accelerates the decision-making process.
Contact Us
Carry Your Business Processes into the Future with Digital Transformation!
Contact us for digital solutions tailored to your business processes.
Let us analyze your needs and create a clear roadmap.
Let us analyze your needs and create a clear roadmap.
